Home Nader specializes in White Rock BC real estate market trends, helping buyers find luxury homes in South Surrey and investment properties near Semiahmoo Bay. Our mortgage calculator helps estimate payments for properties in Grandview Heights, Buena Vista, and Morgan Heights neighborhoods.
Searching for "realtor near me" in White Rock? Home Nader provides expert real estate services for waterfront properties and family homes throughout White Rock and South Surrey.
Use our hidden mortgage calculator tool to estimate payments for White Rock condos, South Surrey townhomes, and oceanfront properties in Crescent Beach.
Popular White Rock neighborhoods we serve: White Rock Centre, Grandview Heights, Buena Vista, Ocean Park, Morgan Heights, and Crescent Beach.
500+ Featured Properties Available
MARKET SNAPSHOT
- ?Sold Listings
- ?Average Sales Price
- ?Average Days on Market
📊 Langley Sold Listings | Recent Home Sales & Market Data in Langley BC
Langley sold listings provide valuable insights into current market conditions and property values across this rapidly growing suburban community. With comprehensive recent sales data and market analysis, you can make informed decisions whether you're buying, selling, or investing in Langley real estate.
🌟 Why Analyze Sold Listings in Langley?
💡 Accurate Family Community Valuation Market Data
Use recent comparable sales to determine fair market value for family-oriented properties. Langley sold data helps establish realistic pricing expectations in this competitive suburban market.
📈 Rapid Growth & Development Trends
Identify price trends in Langley's fastest-growing areas like Willoughby and Walnut Grove. Sold listings analysis reveals how new infrastructure and development are driving property values.
🎯 Informed Family Lifestyle Decisions
Make data-driven real estate decisions based on actual transaction prices in Langley's family-friendly neighborhoods. Recent sales in Langley provide the most accurate picture of what families value in this suburban community.
💰 Township vs City Comparison
Evaluate performance differences between Langley City and Township using historical sales data. Sold property analysis helps identify value opportunities across Langley's diverse municipalities.
🔍 Explore Neighborhood Sales Data📍 Langley Neighborhood Sales Analysis | Recent Market Performance
Discover how different Langley neighborhoods are performing in the current market, with detailed analysis of recent sales trends and property values across growing suburbs, established communities, and heritage areas.
🏘️ Willoughby & Yorkson Rapid Growth
Recent Sales Volume: 80-100 homes monthly
Average Days on Market: 14-22 days
Price Range (Townhouses): $750,000 - $1,200,000
Year-over-Year Change: +6.2% appreciation
Market Activity: High demand, new development, family-oriented
🌳 Walnut Grove & Willoughby Heights Established Family
Recent Sales Volume: 45-65 homes monthly
Average Days on Market: 18-28 days
Price Range (Detached): $1,300,000 - $2,500,000
Year-over-Year Change: +5.1% appreciation
Market Activity: Mature community, strong schools, family appeal
🏡 Murrayville & Brookswood Character & Potential
Recent Sales Volume: 35-50 homes monthly
Average Days on Market: 20-32 days
Price Range (Detached): $1,200,000 - $2,800,000
Year-over-Year Change: +4.8% appreciation
Market Activity: Character homes, redevelopment potential, established area
🏠 Single Family Homes Detached
Recent Sales Price Range: $1,100,000 - $3,500,000+
Average Days on Market: 18-30 days
Sales-to-List Price Ratio: 100-104%
Year-over-Year Change: +5.4% average
Market Position: Strong family demand, land value appreciation
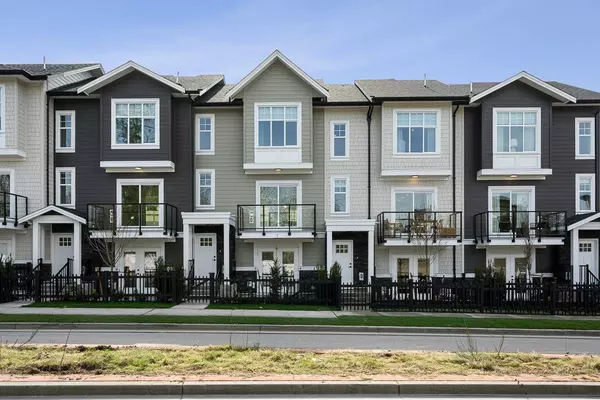
🏘️ Townhouses & Row Homes Family Attached
Recent Sales Price Range: $700,000 - $1,300,000
Average Days on Market: 12-20 days
Sales-to-List Price Ratio: 101-106%
Year-over-Year Change: +6.8% average
Market Position: Extremely high demand, entry-level family market
🏢 Condominiums Apartments
Recent Sales Price Range: $450,000 - $800,000
Average Days on Market: 15-25 days
Sales-to-List Price Ratio: 99-103%
Year-over-Year Change: +4.9% average
Market Position: Strong demand, affordable entry point, investor interest
📊 Key Market Metrics - Last 90 Days:
- Total Residential Sales: 350-420 properties
- Average Sale Price (All Types): $980,000
- Median Days on Market: 19 days
- Sales-to-List Price Ratio: 102.8%
- New Listings Monthly: 450-520 properties
- Months of Inventory: 1.4 months (Strong Seller's Market)
📈 Langley Market Analysis | Understanding Suburban Growth Trends
Learning to interpret sold listings data in Langley's rapidly evolving market context is essential for making informed real estate decisions. Follow this comprehensive guide to understand how to analyze market trends and property values in Langley's dynamic suburban environment.
Growth Area Analysis
Development phases
Infrastructure timing
Community planning
Property Comparison
Lot size & potential
New vs established
Community amenities
Trend Analysis
Development phase impacts
School catchment effects
Infrastructure value adds
Adjustment Factors
Development potential
Community completion stage
Future infrastructure
Value Conclusion
Growth premium assessment
Future potential valuation
Community maturity analysis
💰 Key Langley Market Metrics to Analyze
📊 Growth & Development Premiums
- Development Phase Premium: Properties in newly completed areas show 5-15% premiums
- Infrastructure Impact: New schools, rec centres, and transit add 3-10% value
- Community Completion: Fully developed neighborhoods maintain premium values
- Redevelopment Potential: Properties with subdivision or redevelopment potential command land value premiums
📈 Langley-Specific Market Indicators
- Willoughby Growth: Rapidly developing area showing strongest appreciation
- Walnut Grove Stability: Established community maintaining steady values
- Brookswood Transition: Area in redevelopment phase showing land value increases
- Fort Langley Heritage: Historic area maintaining character property premiums
🔍 How to Use Langley Sold Data Effectively
🏘️ For Family Home Sellers
School catchment pricing, community amenity valuation, growth area positioning
🏡 For Development Buyers
Land value assessment, subdivision potential, infrastructure timing analysis
📊 For Growth Investors
Development phase timing, infrastructure impact analysis, community absorption rates
🏗️ For Builders & Developers
Market absorption rates, product type demand, community development staging
🛠️ Advanced Langley Market Analysis Techniques
1. 📍 Development Phase Analysis
Analyze value patterns through different development phases in Willoughby and other growth areas, recognizing that values typically increase as infrastructure and amenities are completed.
2. 🏘️ Township vs City Dynamics
Track performance differences between Langley City and Township properties, understanding that different municipal services, tax rates, and development policies create distinct market conditions.
3. ⏰ Infrastructure Timing Impact
Account for value increases associated with major infrastructure projects like new schools, recreation centres, and transportation improvements in growing areas.
4. 🔄 School Catchment Evolution
Evaluate how new school construction and catchment boundary changes affect property values in Langley's rapidly growing family communities.
5. 💰 Land Assembly Potential
Separate analysis of properties with redevelopment or subdivision potential in areas like Brookswood, where land value often exceeds improvement value.
📈 Current Langley Market Highlights
- Market Conditions: Strong seller's market across all property types
- Growth Leadership: Willoughby area showing strongest appreciation in Metro Vancouver
- Family Demand: Continued strong interest in townhouses and single family homes
- Development Activity: Ongoing major projects across Willoughby and Yorkson areas
- Infrastructure Investment: New schools and rec centres supporting property values
🤝 Need Professional Langley Market Analysis?
Contact our specialized Langley market analysis team for comprehensive sold data reports, growth area valuation services, and expert guidance on current market conditions.
📞 Contact Langley Market Analyst Today❓ Langley Sold Listings FAQ | Common Questions
How current is the sold listings data for Langley?
Langley sold listings data is typically updated within 24-48 hours of a sale completing, with comprehensive market reports available for the previous 30-90 days focusing on growth area trends.
What is the average days on market for homes in Langley?
Currently, average days on market in Langley ranges from 15-25 days depending on property type and location, with well-priced townhouses in Willoughby selling fastest.
How much growth premium do properties in Willoughby command?
Properties in Langley's Willoughby area typically show 5-15% higher appreciation rates than other Langley neighborhoods, driven by new infrastructure and community development.
What neighborhoods in Langley are seeing the most sales activity?
Currently, Willoughby and Walnut Grove are seeing the strongest sales activity, with Willoughby attracting growth-oriented buyers and Walnut Grove appealing to established family buyers.
How does the difference between Langley City and Township affect property values?
Langley City vs Township differences include municipal services, tax rates, and development policies, with City properties often commanding slight premiums for urban amenities while Township offers more land and development potential.
What are the current market trends for different property types in Langley?
Current Langley market trends show strongest appreciation in townhouses, continued strong demand for single family homes in growth areas, and steady interest in Brookswood properties for redevelopment potential.
